HDFC SKY is thrilled to announce the integration of TradingView Charts into our platform. Now, traders and investors can choose between two powerful charting options: TradingView and ChartIQ, all to suit their preferences. One view with all the details on web.
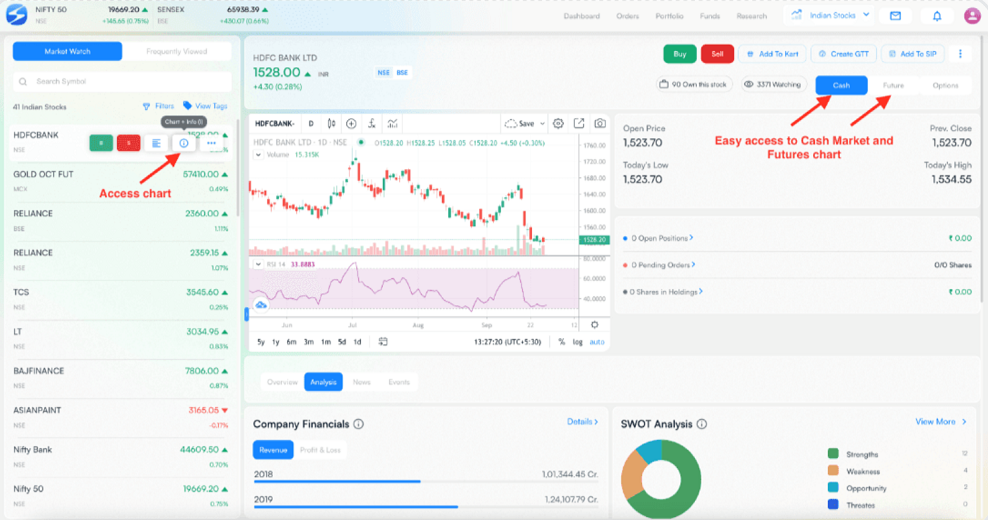
Key Features at Your Fingertips:
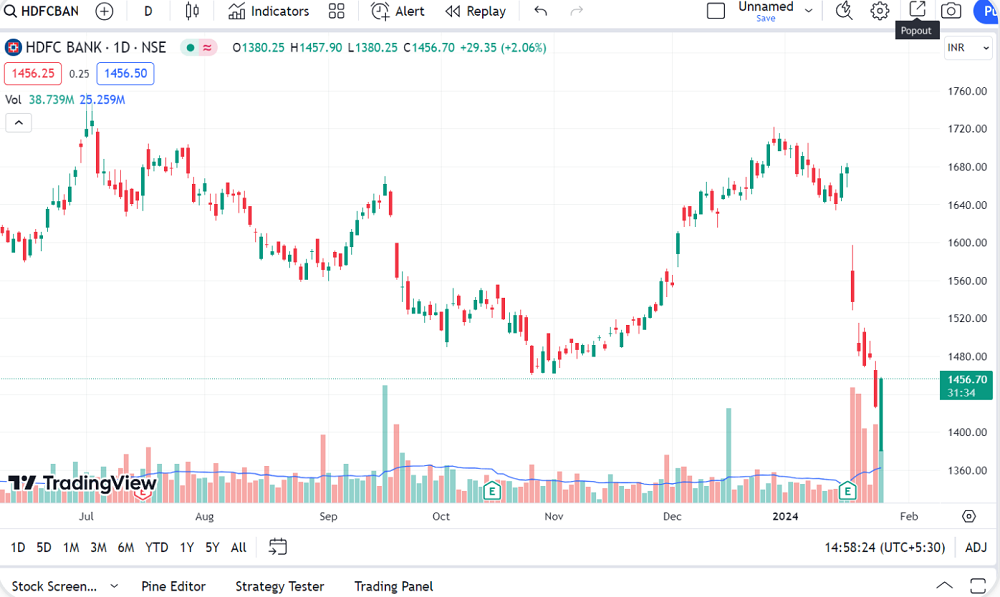
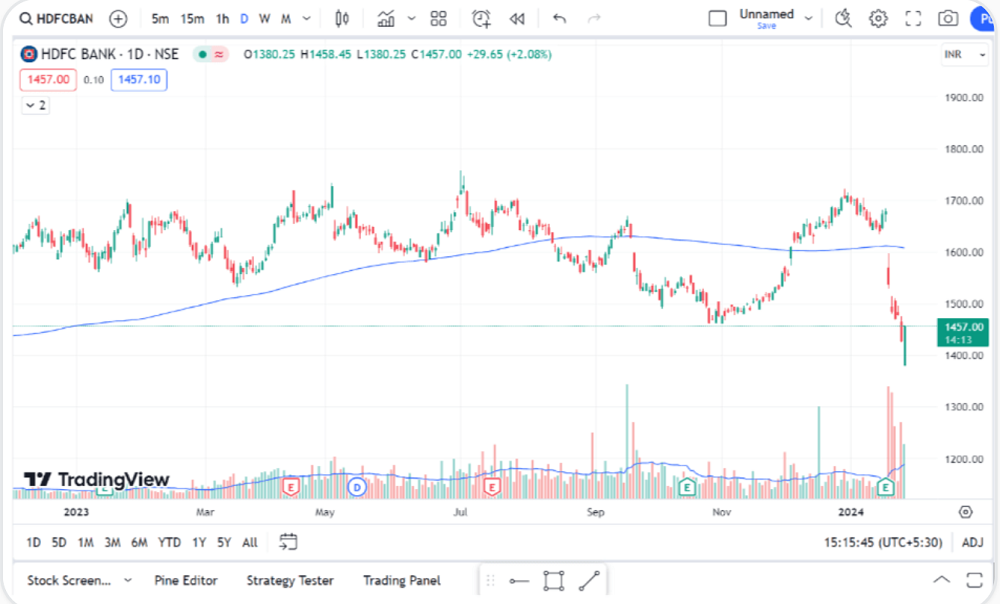
1. Multiple Full screen charts View with Pop-Out Feature
Open multiple full-screen charts for different stocks, each with customizable time frames.
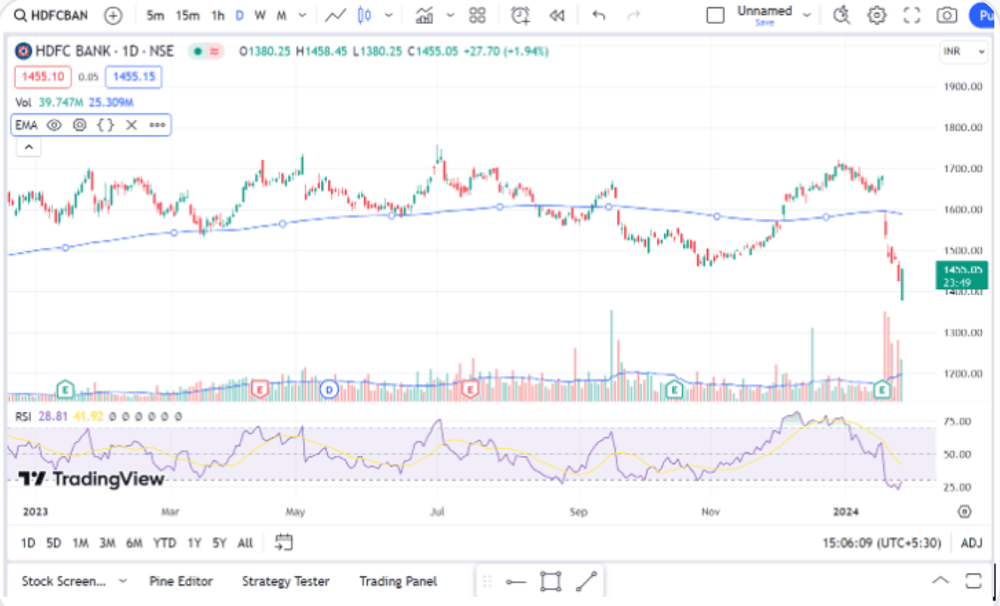
2. Advanced Indicators and Drawing Tools
Empower your technical analysis with an extended list of indicators and drawing tools.
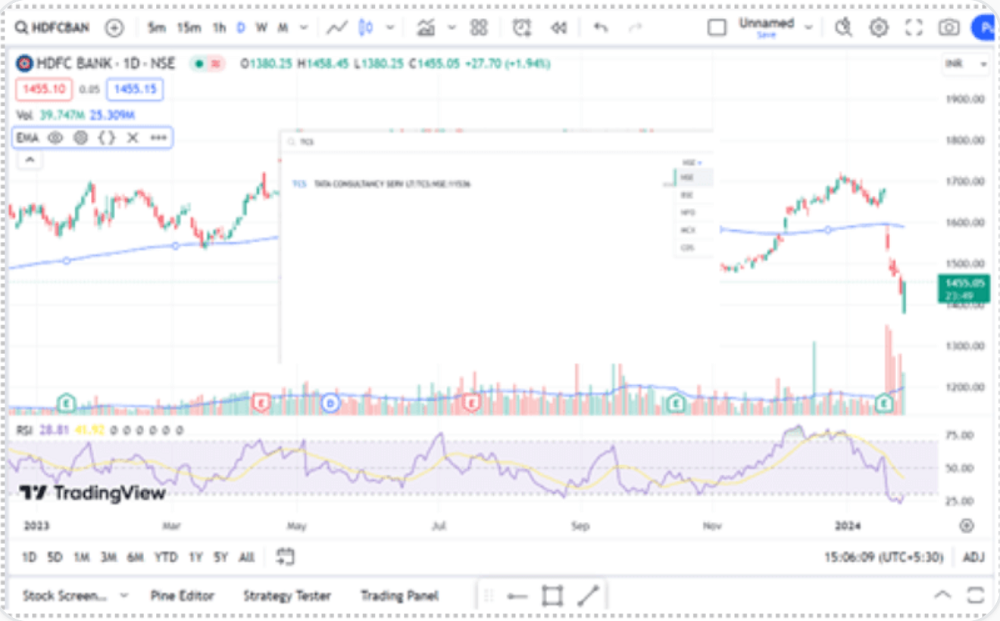
3. Effortless Stock Search and Addition
Simply type your preferred stock's name (e.g., TCS) while viewing a full-screen chart using your keyboard. The chart platform will automatically open a search window for stock selection.
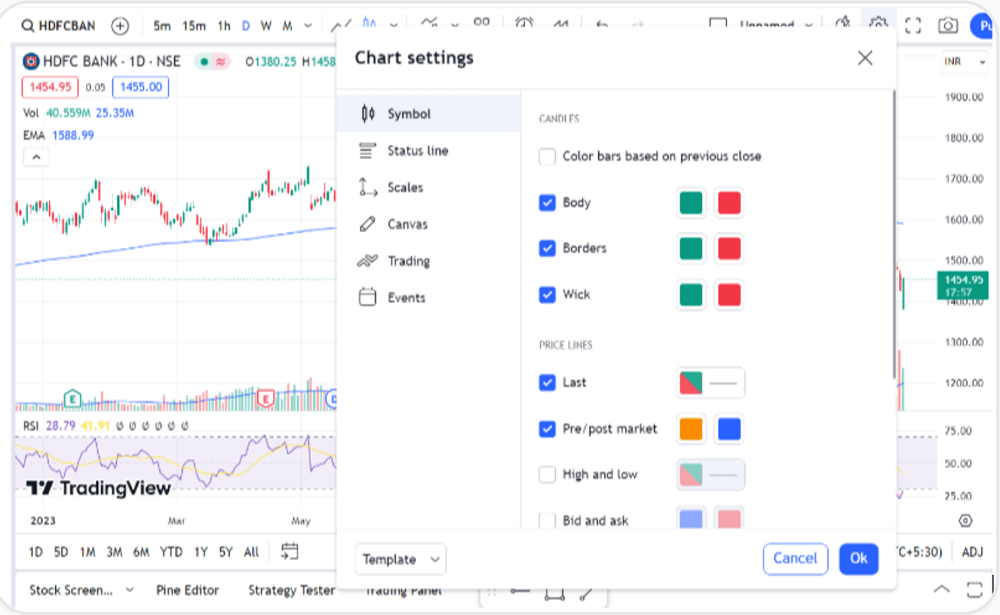
4. Customizable Chart Colors and Lines
Tailor your charts with a rich palette of colors and a variety of line combinations for enhanced clarity.
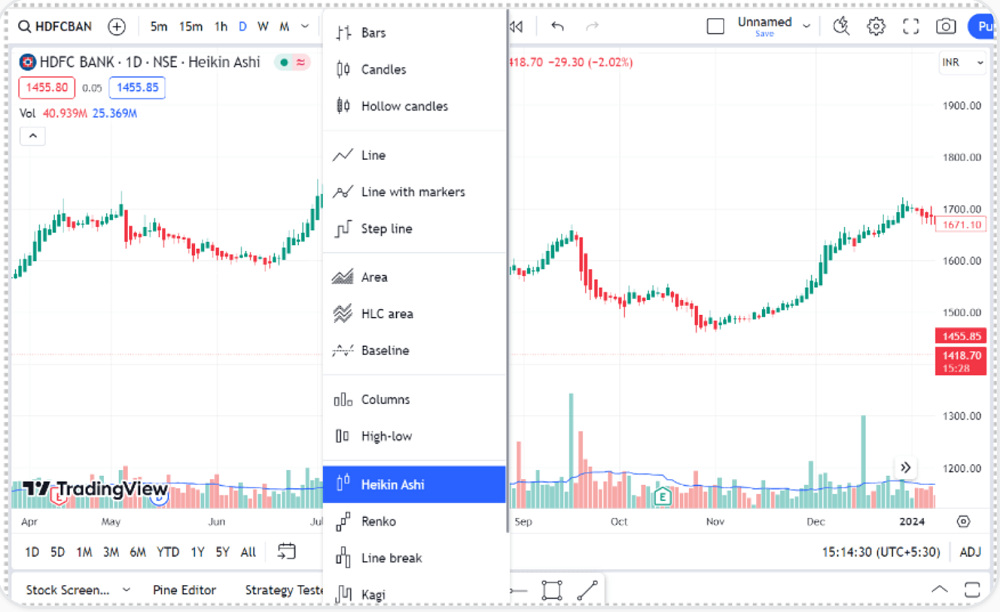
5. Diverse Chart Types
Switch between candlestick charts, bar charts, line charts, Heikin-Ashi charts, and more to match your analysis style.
6. Navigate to Specific Dates and time frame
Explore how a stock performed on a specific day, making it a powerful tool for historical analysis.
HDFC SKY's integration of TradingView delivers the same seamless charting experience as the TradingView website. Additionally, you gain access to real-time financial news and an economic calendar. Stay informed about crucial events and economic data that can impact your trading decisions.